I've recently been doing some performance analysis work on Linux, which requires profiling various applications to see how they perform under load. One of the handy tools for profiling this behaviour is oprofile, but the output can be a little difficult to interpret.
So, I've developed hiprofile, the HTML interactive profiler.
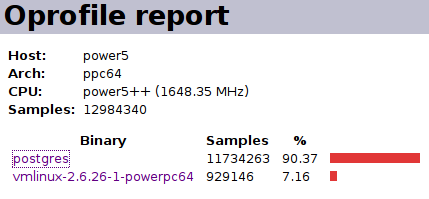
Hiprofile is a small python script to generate HTML reports for oprofile data. Output is broken down into per-program statistics:
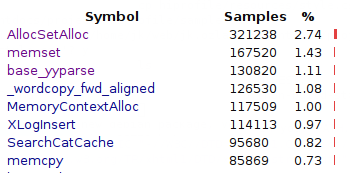
The page for each program lists the top 20 (by default) symbols within that function:
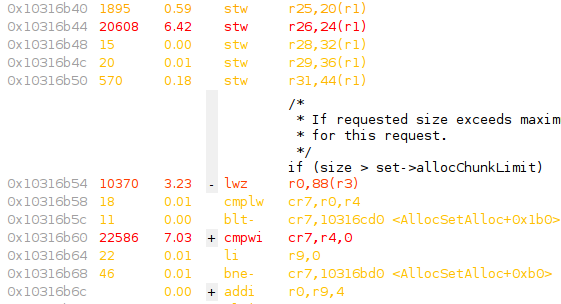
Each of the most-hit functions are show with per-instruction profiling data, and each instruction is coloured according to how 'hot' it is. If the source code for the function is available, the output is annotated with the corresponding code:
More info and downloads are on the hiprofile project page.